


DJI-manufactured drones comprise more than 96% of drone operations in the US National Airspace System, according to the latest research from the FAA’s Center of Excellence for UAS Research Alliance for System Safety of UAS through Research Excellence (ASSURE) 2025 annual report. Researchers from Embry-Riddle Aeronautical University, Kansas State University, NIAR and Wichita State University have published the latest analysis of drone operations in the USA, using UAS remote Identification data in conjunction with air traffic data, UAS registrations, airspace metrics, and other geographic information system data.
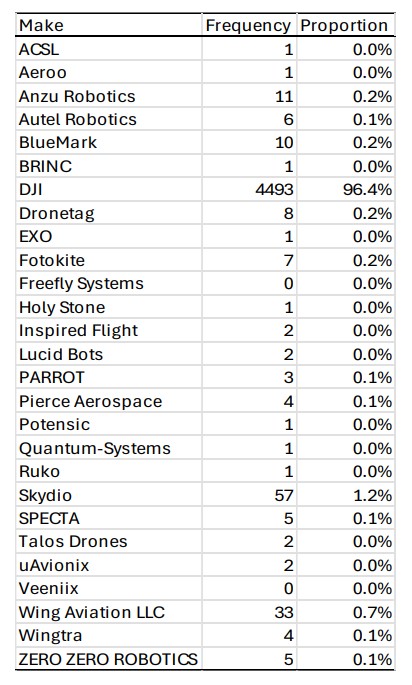
“Use of Dà-Jiāng Innovations (DJI)-manufactured platforms remains dominant, with the company comprising more than 96% of detected platforms. Skydio made up slightly more than 1% of platforms. Remaining manufacturers accounted for less than 2.4% of platforms,” said the researchers.
“As identified in previous studies, detected models favoured small, less than 0.55 lb platforms, including the Mini 4 Pro (19%), Air 3 (13%), Air 2 S (7%), and Air 3 S (7%). The Mavic 3 Pro, an approximately 2.1 lb platform, continues to show strength, making up about 8% of detected platforms. Larger platforms, such as the Matrice 30T—an 8 lb platform—show marked growth from prior studies, although they still make up only a small proportion of overall platforms. Similarly, the data showed several large, specialized platforms such as the Matrice 400, Agras T50 and T25, and FlyCart 30; however, these platforms only comprised a small proportion of overall detections. The Mavic 3 shows waning usage—approximately half the activity since the previous reporting. More than 93.7% of the top 22 most commonly detected platforms were 3 lbs or less.”
Most of the most commonly detected UAS platforms weighed less than three pounds and were flown at altitudes less than 400 Feet AGL. In contrast, only 5.3% of UAS operations occurred above 500 feet AGL—a base altitude where routine manned aircraft operations take place. Most UAS flights were conducted at relatively slow speeds. Analysis of speed data shows that nearly half (49.3%) the telemetry of UAS flights were static, while an additional 26.9% were conducted at relatively slow speeds below 15 mph, indicating most flights involve hovering or slow, controlled movement. In contrast, only 7.8% of UAS operations occurred at speeds exceeding 30 mph, and a negligible 0.1% were flown above 50 mph.
“This finding reinforces that the vast majority of flight operations are occurring at either low or stationary speeds,” said the researchers. “While slower speeds limit kinetic damage potential from a collision, it also makes UAS much more difficult to see, as peripheral movement is a key visual indicator for spotting potential UAS collision risks.”
Analysis of operator separation distances indicates that UAS flights are predominantly conducted very close to the remote pilot. Nearly 58.2% of collected telemetry data show operator flight distances of less than 0.1 NM, with an additional 17.4% occurring between 0.1 and less than 0.2 NM. Overall, more than 92.6% of UAS operations took place within 0.5 NM of the operator, demonstrating that the vast majority of flights likely remain well within the shortrange, visual line-of-sight of operators.
Analysis of UAS telemetry against LandScan population metrics shows that ground risk to people is generally low. Nearly 45.4% of operations occurred in areas with zero population density, and most remaining flights were in low-density environments, with less than 10% in moderate-density areas. Flights in higher-density regions were uncommon, with only about 8.5% of operations occurring in the highest population category. Analysis of UAS activity in the vicinity of aerodromes reveals that a portion of operations occur at relatively close distances. Although most datapoints (70%) were nearest to airports, nearly one-third (30%) were closest to heliport facilities, and UAS flights were typically conducted at shorter distances from heliports than from airports. “This trend aligns with previous research and may be driven by the fact that heliports are often not included on standard aeronautical charts and commonly used UAS planning tools, increasing the likelihood of unintentional operations in close proximity to heliport facilities,” says the report.
Analysis of detected UAS Remote ID telemetry relative to UAS Facility Maps shows that 39.1% of operations occurred within mapped areas, while 60.9% took place outside UAS Facility Map coverage. Overall, 58.0% of UAS operations were conducted above the applicable UAS Facility Map grid altitude limits, compared to 42.0% below. “While most operations occur in environments that present relatively low risk, the findings also identify specific conditions—such as proximity to aerodromes, operations near heliports, and flights above UAS Facility Map grid limits—that warrant continued attention. Collectively, these results demonstrate the value of Remote ID data as a scalable tool for understanding UAS behavior, supporting risk-based oversight, and informing future operational, technical, and regulatory decisions for safe integration into the NAS.”
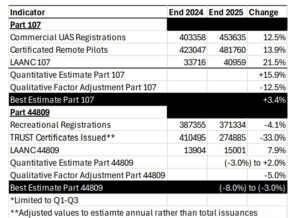
As of November 2025, the agency recorded a cumulative 453,635 commercial registered UAS; 371,334 recreational flyer registrations; 12,544 paper UAS registrations (typically for UAS above 55 lbs); 481,760 certificated remote pilots; and 1,226,168 [The] Recreational UAS Safety Test (TRUST) certificates issued.
The authors received de-identified LAANC authorization data extending from January 1, 2025, to November 30, 2025, which included 688,716 individual authorizations. As of August 2025 the FAA (2025a) reported 1,219 airports actively participated in the LAANC approval system, which included 961 civil airports, 81 military airports, and 13 joint-use facilities. Collected data included 501,582 Part 107 authorization requests (72.8%) and 187,134 Part 44809 requests (27.1%). Monthly activity showed a minimum of 734 active LAANC airports during the sampling period. An overview of system-wide LAANC activity is provided in Figure 5. For the 11-month sample January-November 2025, growth stood at 9.2% over the same period in 2024.
For more information
https://assureuas.com/wp-content/uploads/2024/07/A83_2025-Annual-Report_v5_web.pd
(Image: Shutterstock)